PROJECTS
Retail Sales Analysis — Mercado Pueyrredón
📌 Problem
The company lacks visibility on which products drive revenue.
⚙️ Approach
Designed a SQL data model and Power BI dashboard to analyze sales by category, product and time.
📊 Key Insight
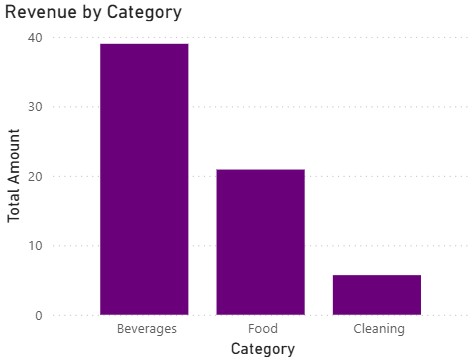
Beverages generate the highest revenue and sales are concentrated in a small set of products.
Internal Business Dashboard
Key Insights:
- Beverages generate the highest revenue
- Sales are concentrated in a few key products
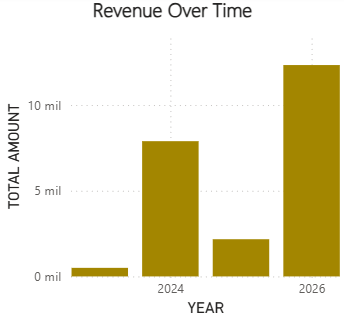
- Sales show variation across different periods
💡 Business Impact:
- Enabled identification of revenue-driving categories to support inventory decisions
- Highlighted product concentration in a small subset of items (Pareto effect)
- Provided visibility into sales trends to support demand planning
- Reduced reliance on intuition by introducing data-driven insights
Static Dashboard Preview:
Interactive Dashboard
🧠 Technical Decisions:
- Normalized data model to simulate real retail structure
- Used joins across sales and products for multi-level analysis
- Calculated revenue using transactional granularity
💻 Technical Assets:
Delivery Analytics — Geo & Sales Insights
📌 Problem
The business lacks visibility on geographic performance and revenue distribution.
⚙️ Approach
Built a SQL-based data model and Power BI dashboard to analyze orders, revenue and geolocation patterns.
📊 Key Insight
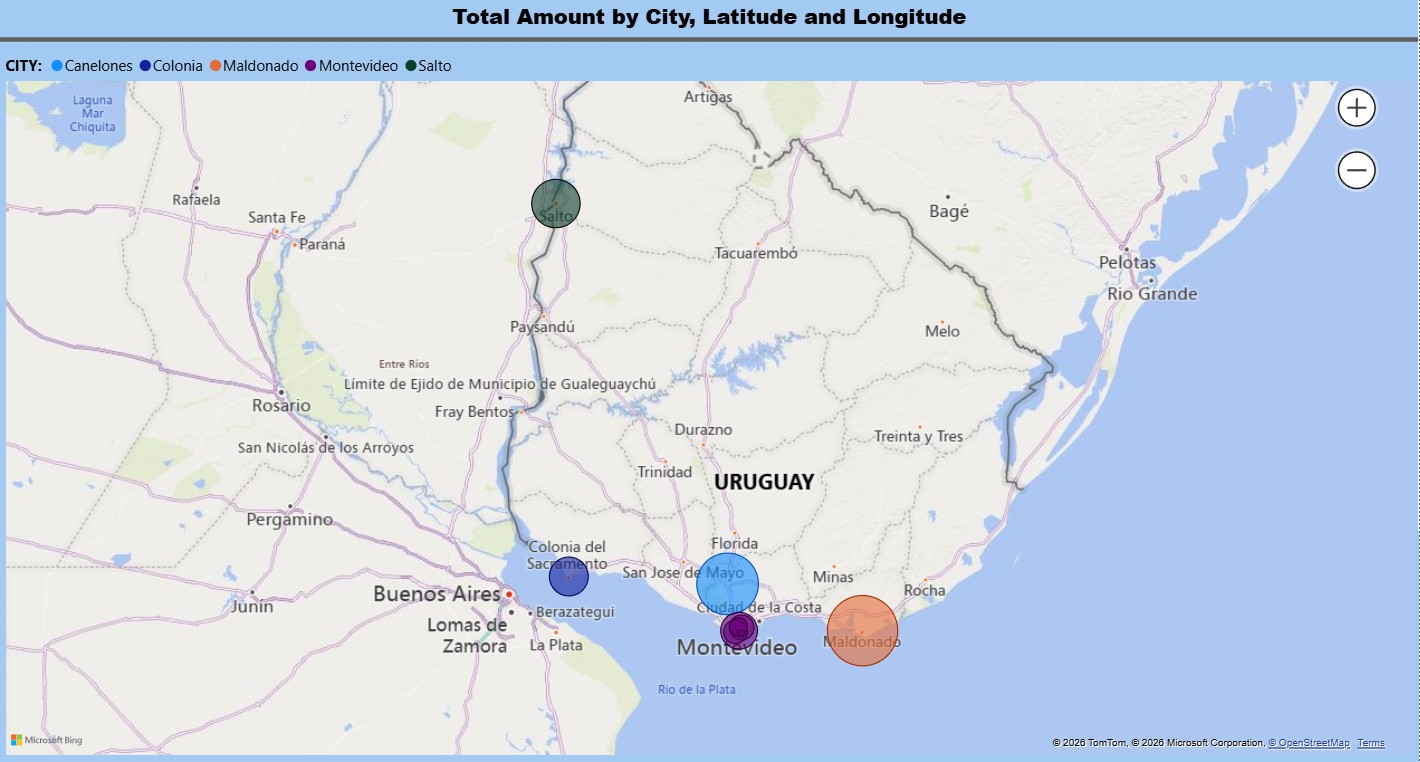
Montevideo shows the highest order density, while some regions generate higher revenue with fewer orders.
Delivery Performance Dashboard
Key Insights:
- Revenue distribution varies significantly by city
- Montevideo shows the highest order density
- Some regions generate higher revenue with fewer orders
- Geolocation enables better delivery optimization
💡 Business Impact:
- Identified high-demand geographic zones to optimize delivery coverage
- Revealed areas with high revenue but low order frequency (growth opportunities)
- Supported strategic decisions for expansion and logistics optimization
- Improved visibility into geographic performance and demand distribution
Static Map Preview:
Interactive Dashboard
🧠 Technical Decisions:
- Normalized data model to simulate real retail structure
- Used joins across sales and products for multi-level analysis
- Calculated revenue using transactional granularity
💻 Technical Assets:
Customer Analytics — Segmentation & Revenue Insights
📌 Problem
The business lacks visibility on customer value and segmentation.
⚙️ Approach
Designed a SQL data model and Power BI dashboard to analyze customer behavior, revenue and segmentation.
📊 Key Insight
A small group of customers drives most revenue, while many customers fall into low-value or at-risk segments.
Customer Analytics Dashboard
Key Insights:
- Revenue is concentrated in a small group of VIP customers
- Several customers show low engagement and low spending
- Customer segmentation enables targeted strategies
- Geographic distribution reveals growth opportunities
💡 Business Impact:
- Identified high-value (VIP) customers driving the majority of revenue
- Detected low-engagement and at-risk customers for retention strategies
- Enabled customer segmentation for targeted marketing actions
- Provided a foundation for customer lifecycle and retention analysis
Static Dashboard Preview:
Interactive Dashboard
🧠 Technical Decisions:
- Normalized data model to simulate real retail structure
- Used joins across sales and products for multi-level analysis
- Calculated revenue using transactional granularity